
Quarterly Regional Stability & Capital Velocity Report
Measurable Clarity for Regional Decision Makers
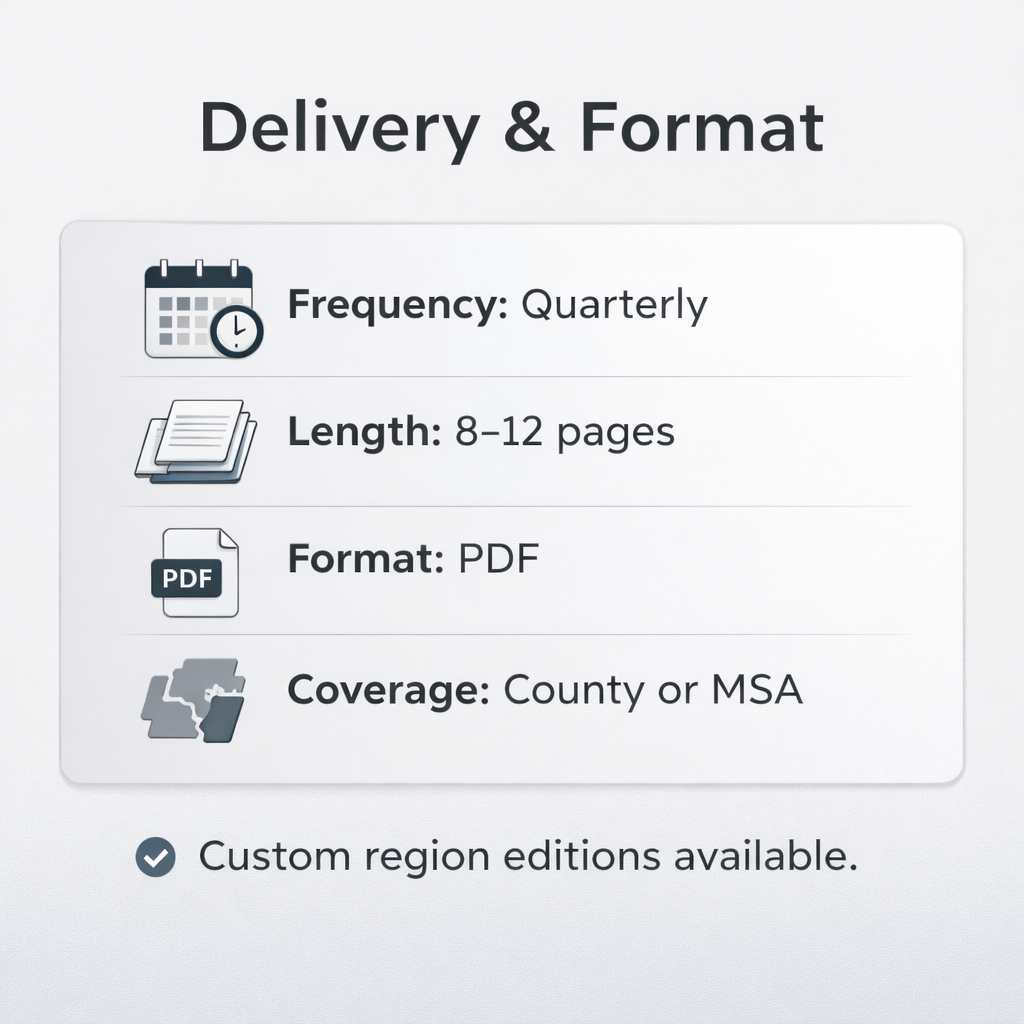
The Regional Intelligence Monitor (RIM) is a quarterly, data-driven assessment of a county or metro’s operating environment.
It does not forecast.
It does not speculate.
It quantifies economic conditions shaping business outcomes.
Each edition evaluates workforce stability, infrastructure capacity, capital access, regulatory friction, market demand, and capital velocity using a composite scoring model built from federal data, administrative records, and validated model estimates.
The result is a single integrated view of regional economic stability — delivered in operational language.
What the Report Actually Delivers
1. Composite Stability Index (0–100)
At the center of each edition is a weighted, cross-dimensional Stability Index™ reflecting structural business conditions across the region. This index is not sentiment or commentary; it is a quantified classification derived from normalized inputs across multiple domains.
2. Six Core Operating Dimensions
Each report analyzes:
- Workforce Stability
- Infrastructure Capacity
- Capital Access
- Regulatory Environment
- Market Demand
- Capital Velocity
Each dimension receives:
- A normalized score
- Supporting metrics
- Directional pressure assessment
- Operational implications
You see not only the score — but what is driving it.
3. Constraint Interaction Mapping
Most reports isolate metrics…RIM evaluates interactions.
Examples:
- Workforce × Demand
- Infrastructure × Velocity
- Regulatory × Capital Access
This reveals where friction compounds — and where conditions amplify growth.
It surfaces structural bottlenecks before they become performance failures.
4. Stakeholder-Specific Implications
Each edition includes practical interpretation for:
- Lenders
- Economic development leadership
- Business operators
No theory. No frameworks to implement. Just operational consequences under current conditions.
How It’s Built
Each quarterly edition draws from:
- U.S. Bureau of Labor Statistics (BLS)
- Federal Reserve Economic Data (FRED), Federal Reserve Bank of St. Louis
- U.S. Census Bureau (American Community Survey and related datasets)
- Lagged administrative records
- Model-estimated county indicators
- Cross-validation across 25–30 core metrics
Each metric is classified by:
- Official vs. estimated
- Lag profile
- Geographic scope
- Verification standard
Transparency is embedded in the methodology.
What RIM Is Not
- It is not a consulting engagement.
- It is not a forecast.
- It is not an economic development marketing piece.
- It does not require interpretation training.
It is a structural operating environment report.
Who Uses It
- Regional banks adjusting underwriting posture
- Private equity groups evaluating local deployment risk
- Economic development offices stress-testing recruitment strategy
- Multi-location operators assessing expansion timing
- Infrastructure planners evaluating deployment friction
If your capital, lending, hiring, or expansion decisions depend on regional stability — this report exists for you.
After the Report
Some organizations use RIM for quarterly board reporting. Some integrate it into underwriting memos. Some use it to validate (or challenge) internal economic assumptions. The report stands alone. There is no required advisory engagement.
If you want deeper analysis or regional modeling, that is a separate discussion.
The Objective
The objective is not interpretation.
The objective is measurable clarity.