
See how the whole economic conditions is behaving.
A structural measure of economic conditions
See the current national economic conditions explained.
Watch the latest national Economic Pulse™ briefing for a concise interpretation of the Composite Health Score, major operating pressures, Capital Velocity, interaction effects and the forward scenario range.
The archive provides a time-sequenced record of national Economic Pulse™ briefings so changes in economic conditions can be reviewed across reporting periods.
More data does not automatically create clearer decisions.
Modern organizations can access GDP, inflation, employment, retail sales, permits, lending conditions and hundreds of other indicators. The difficulty is understanding how those conditions interact and what the combined structure means for an actual operating decision.
The Economic Pulse™ measures the environment as a connected system—not a collection of isolated statistics.
Traditional reporting tells you what moved.
Useful indicators are often presented separately, leaving leaders to determine how labor, infrastructure, capital, policy and demand fit together.
The Economic Pulse™ shows how the movement fits together.
It standardizes current conditions, evaluates interaction effects, identifies constraints and converts the result into a concise operating assessment.
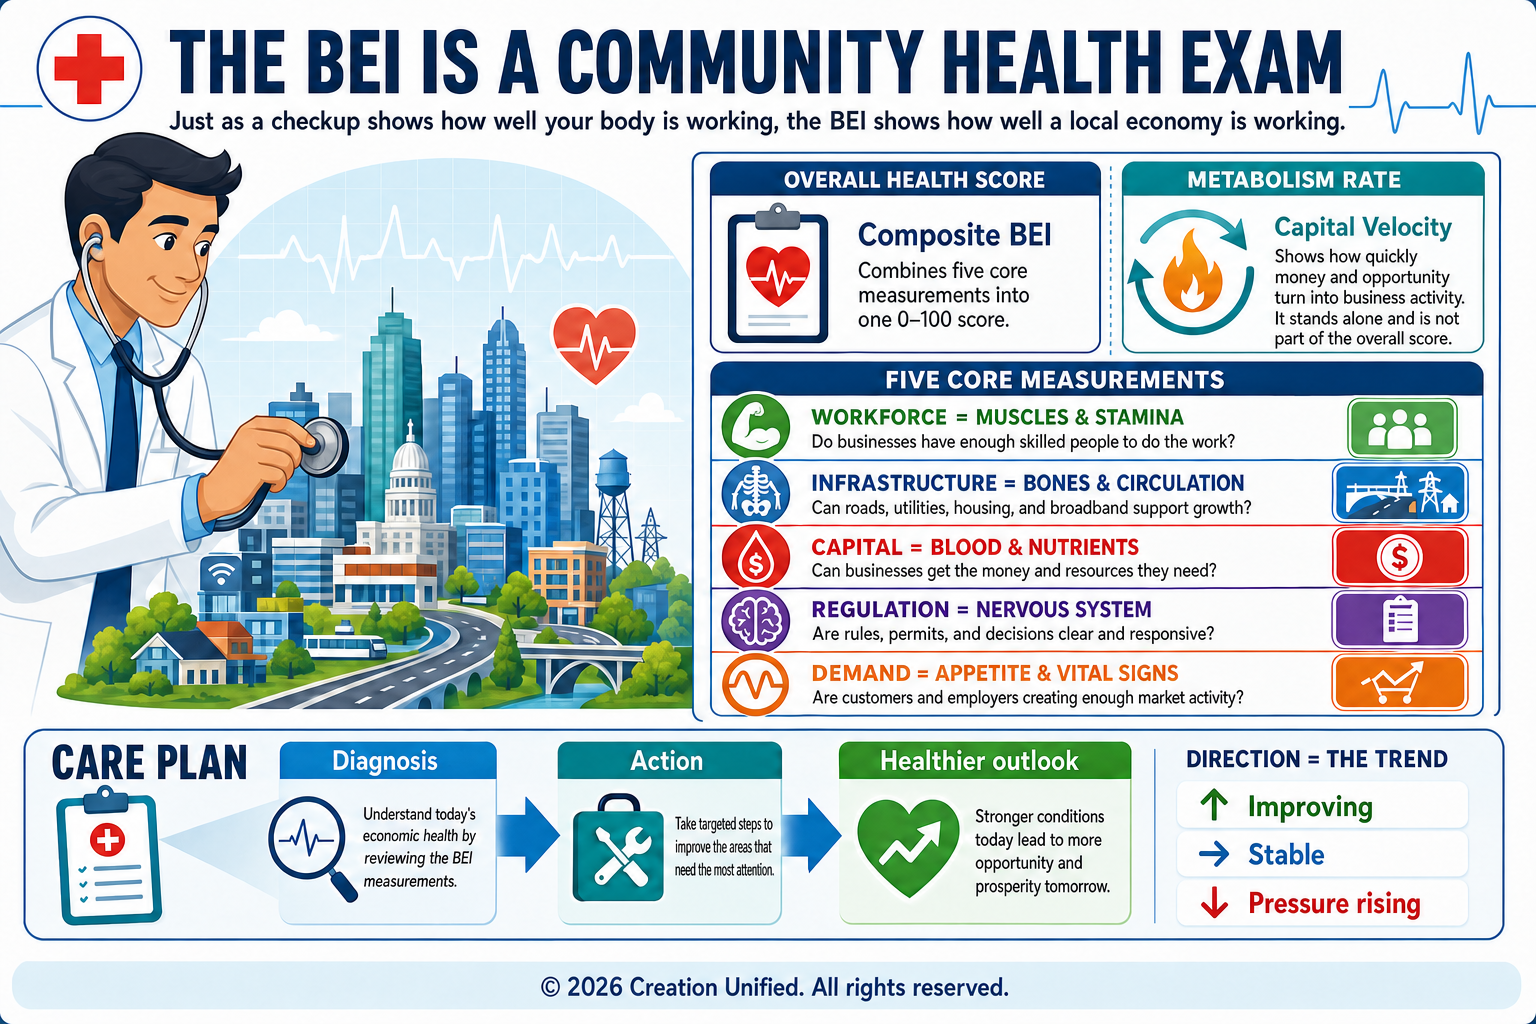
See the Economic Pulse™ framework at a glance.
This visual overview shows how the Economic Pulse™ brings together the Composite Health Score, five core dimensions, interaction effects, constraints and Capital Velocity into one integrated view of the economic conditions.
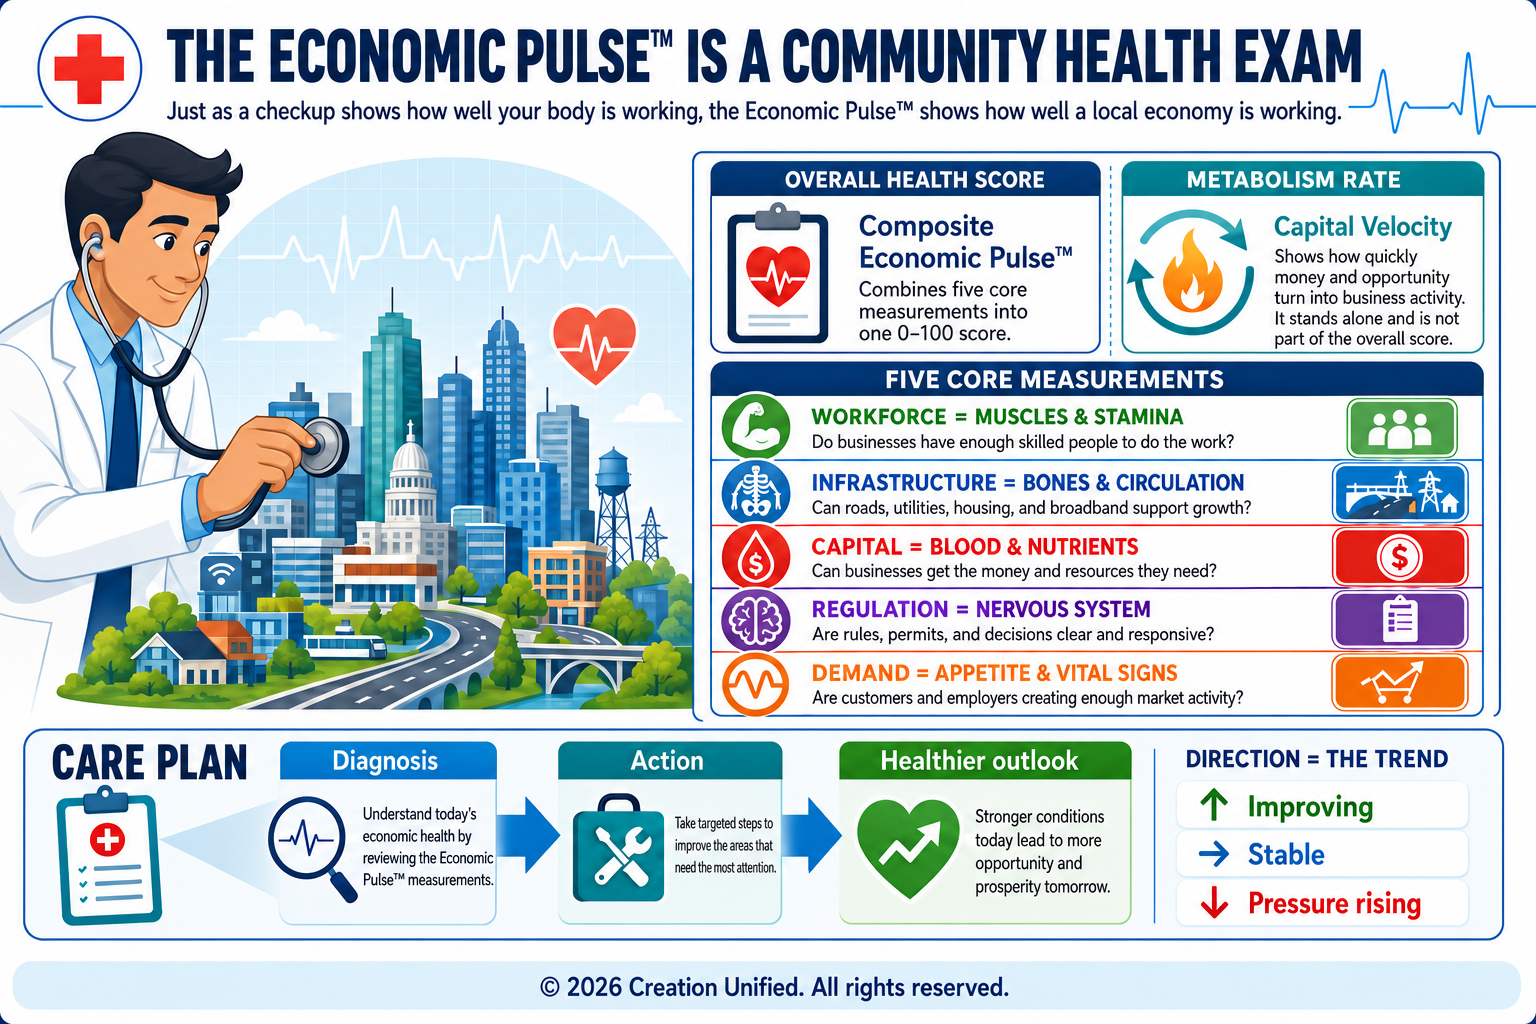
Click the infographic to expand it.
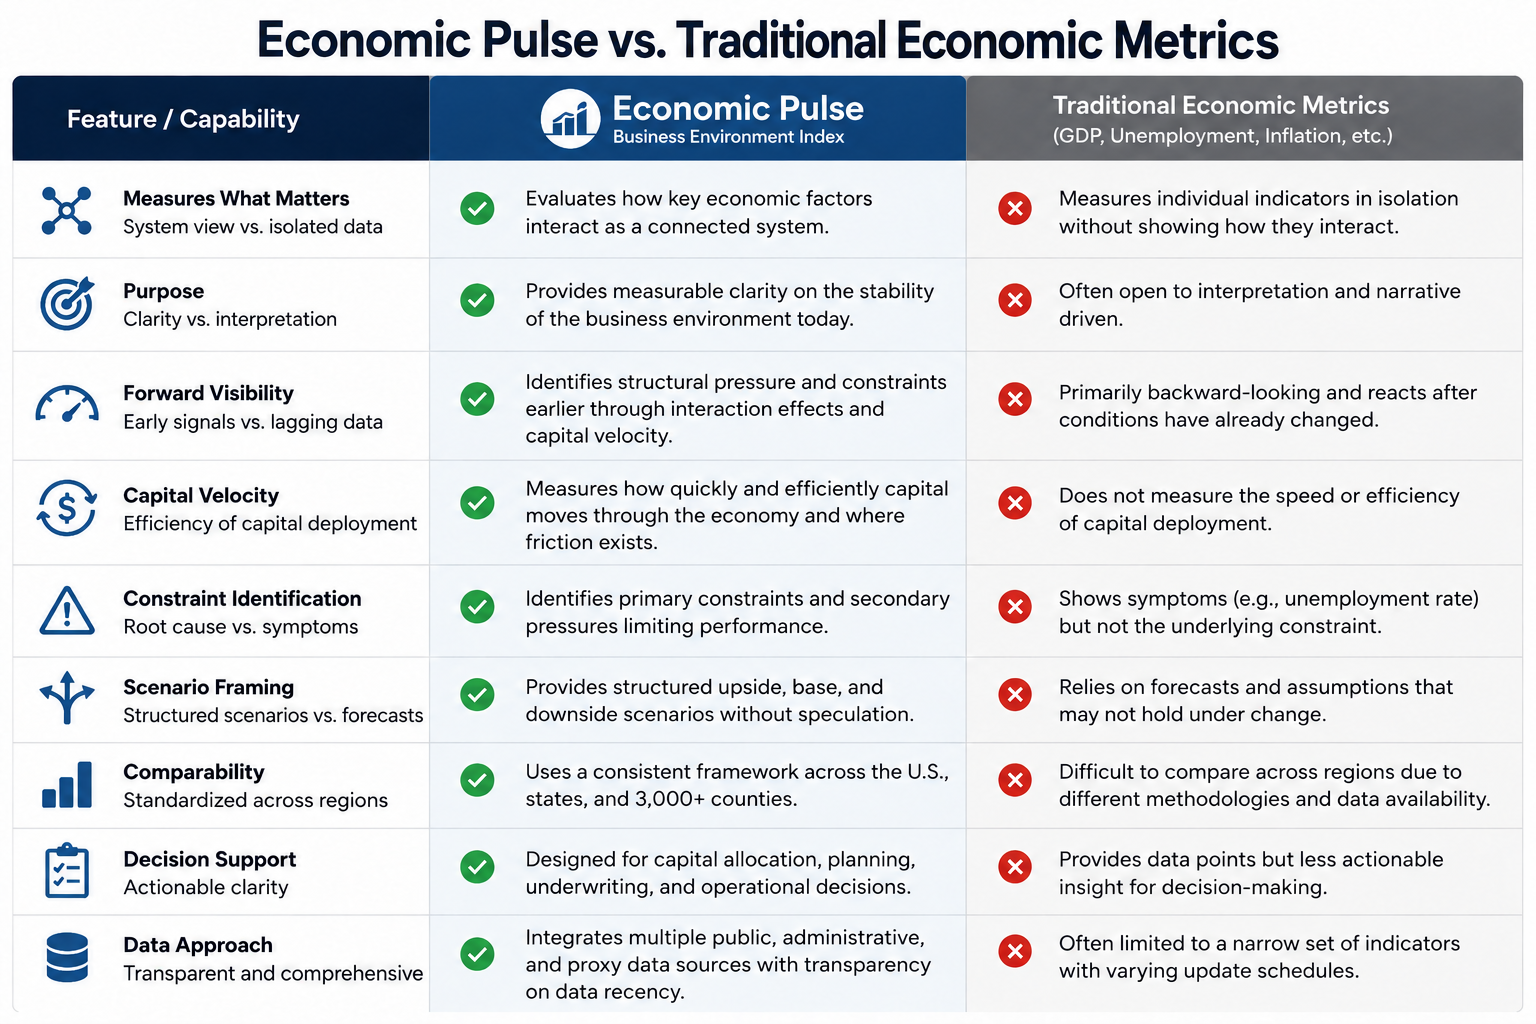
A structural layer traditional indicators do not provide.
The comparison below shows the distinction between measuring isolated economic outputs and evaluating the operating relationships among them.
One 0–100 measure of overall economic conditions.
The Economic Pulse™ Composite Health Score is a proprietary 0–100 assessment built from five core dimensions and the structural relationships among them. It is designed to function as a concise health indicator for the economic conditions while preserving visibility into the strengths, constraints and interaction effects that produce the result.
The Composite Health Score is not a government statistic, sentiment poll or simple average. It is a normalized structural assessment produced through Creation Unified’s proprietary scoring framework using five core dimensions and ten measured interaction effects.
Capital Velocity measures conversion efficiency—not environmental health.
The Capital Velocity Index is reported separately from the Composite Health Score. It does not function as a sixth dimension and is not one of the five inputs used to define the core dimensional structure.
Instead, Capital Velocity evaluates how efficiently available capital appears to convert into business formation, employment, construction, investment and demand activity. A region can have a solid Composite Health Score while capital conversion is slowing, or a weaker health score while capital is moving rapidly through a narrow part of the economy.
The index is interpreted independently, then read alongside the Composite Health Score, the five dimensions, the ten interaction effects and the identified constraints.
Five core dimensions of the operating environment.
Every report combines standardized scoring, directional movement and a concise explanation of what is strengthening or weakening the selected region.
Labor availability, employment resilience, workforce pressure and the ability to support ongoing operations.
Transportation, logistics, housing, utilities and the physical systems required to convert demand into activity.
Lending conditions, financing availability, investment activity and the cost of deploying capital.
Administrative friction, permitting pressure, inflation exposure and policy stability.
Consumer activity, business demand, purchasing power and the durability of regional economic activity.
Explore a sample Economic Pulse™ Composite Score.
The explorer begins with the United States Q1 2026 national sample. Adjust the five core dimensions to see how the proprietary Composite Health Score, constraint profile and decision posture respond. Capital Velocity is shown separately because it is an independent proprietary index rather than a sixth dimension. This is an educational demonstration—not a substitute for a complete report.
Adjust the controls to explore how changes in the five dimensions affect the overall operating environment.
Early signals to monitor
- Inflation and input-cost direction
- Permitting and construction throughput
- Financing sensitivity in expansion plans
Review the full report format at three geographic levels.
Each ZIP package shows how the standardized framework is applied while preserving the local data, constraints and operating context of the selected geography.
See the national baseline format, composite score, five core dimensions, the separate Capital Velocity Index, ten interaction effects and scenario ranges.
Download National Sample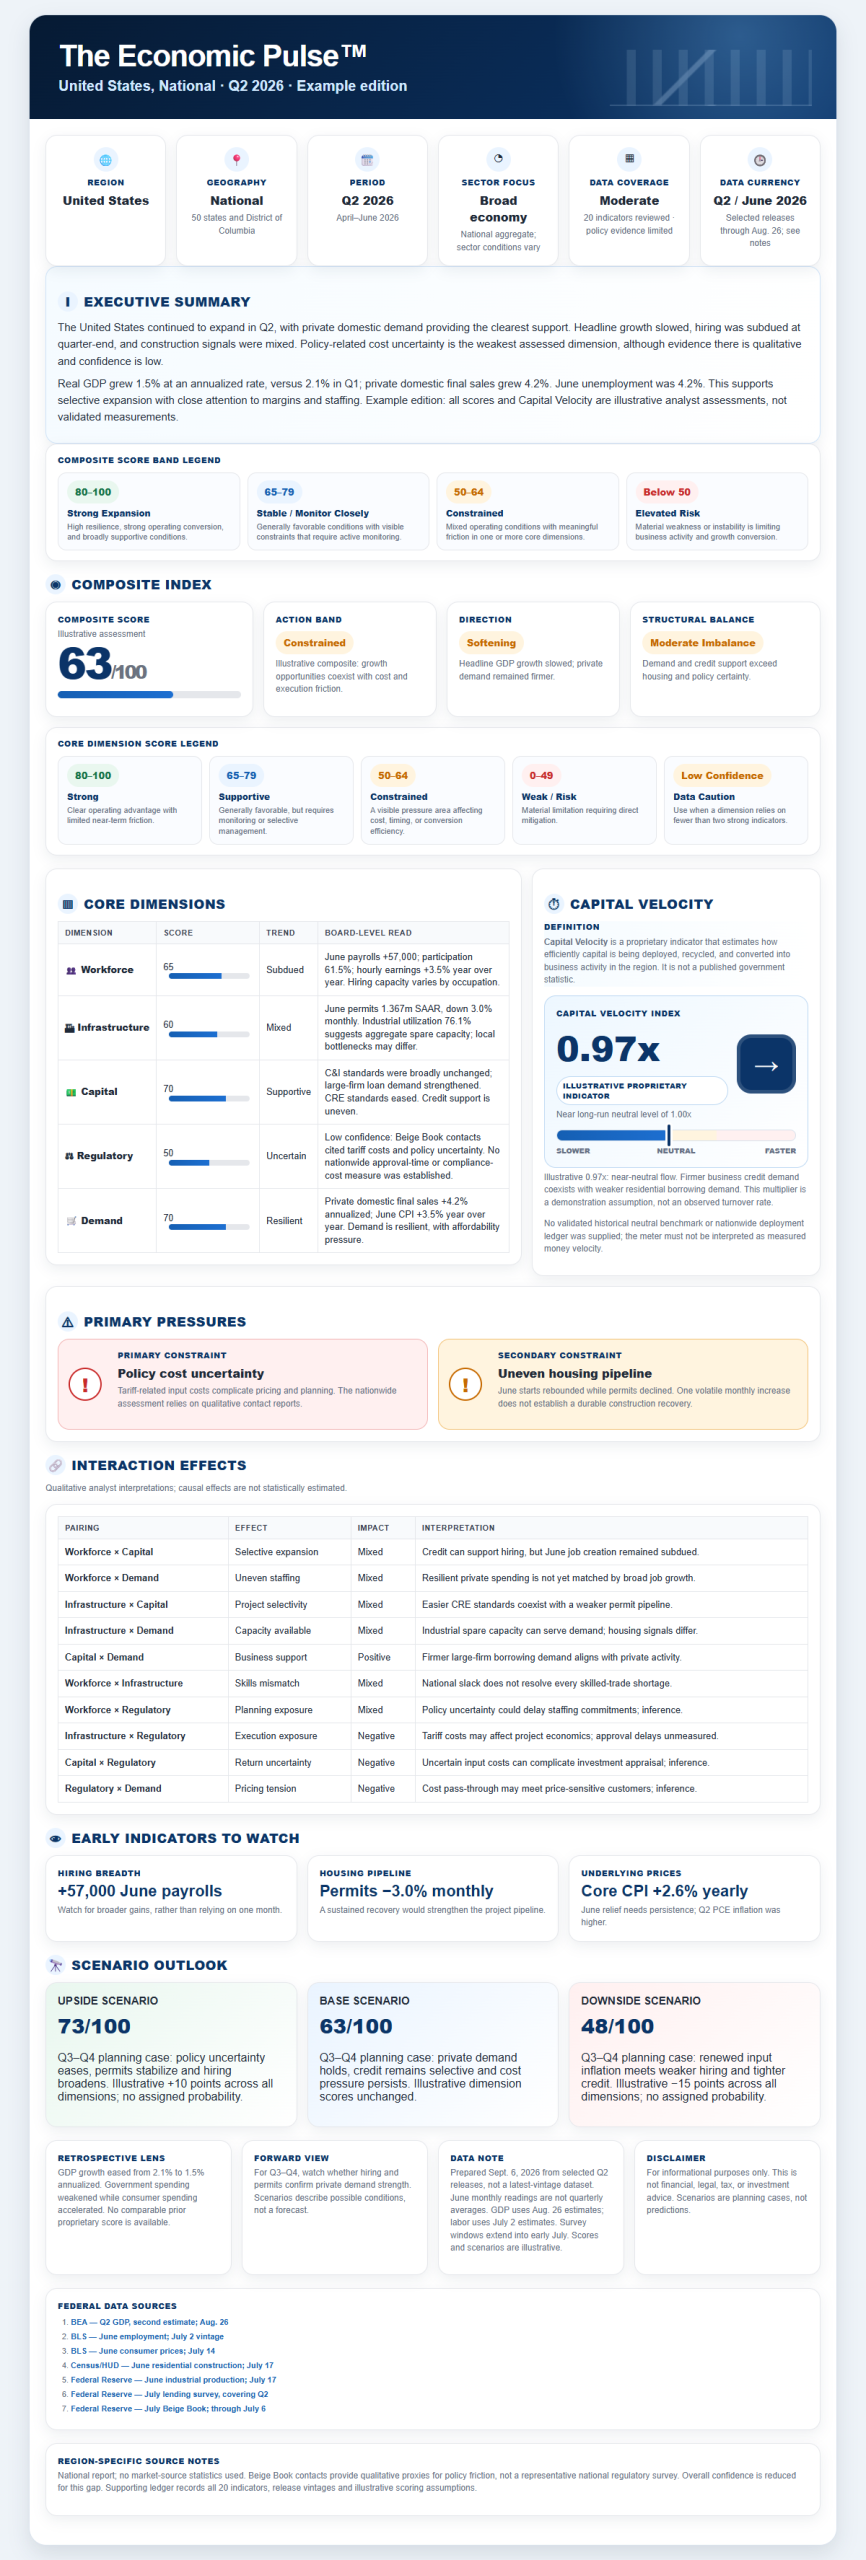
Review how the Economic Pulse™ translates the same proprietary framework into state-level operating intelligence.
Download State Sample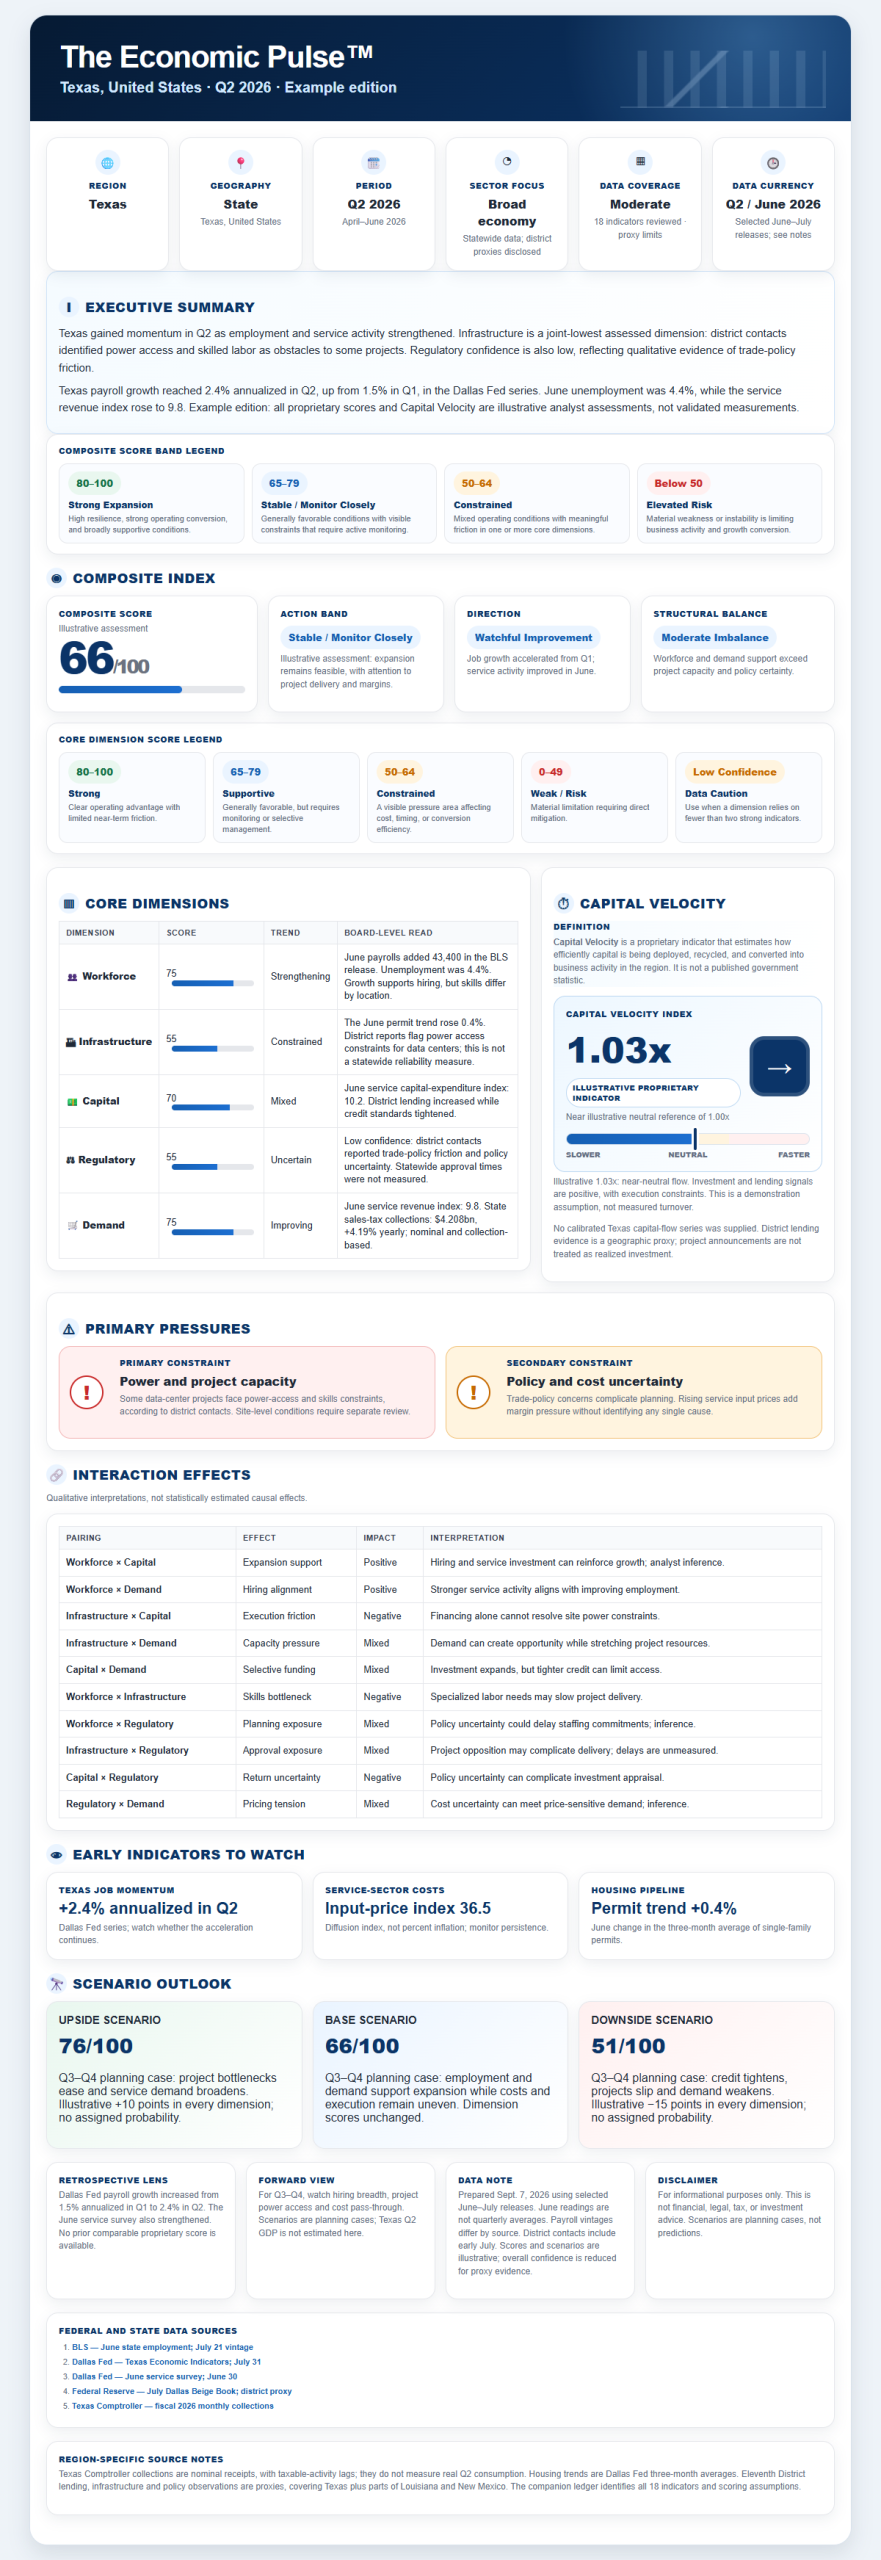
See the county-level report structure for local business, lending, development and expansion decisions.
Download County Sample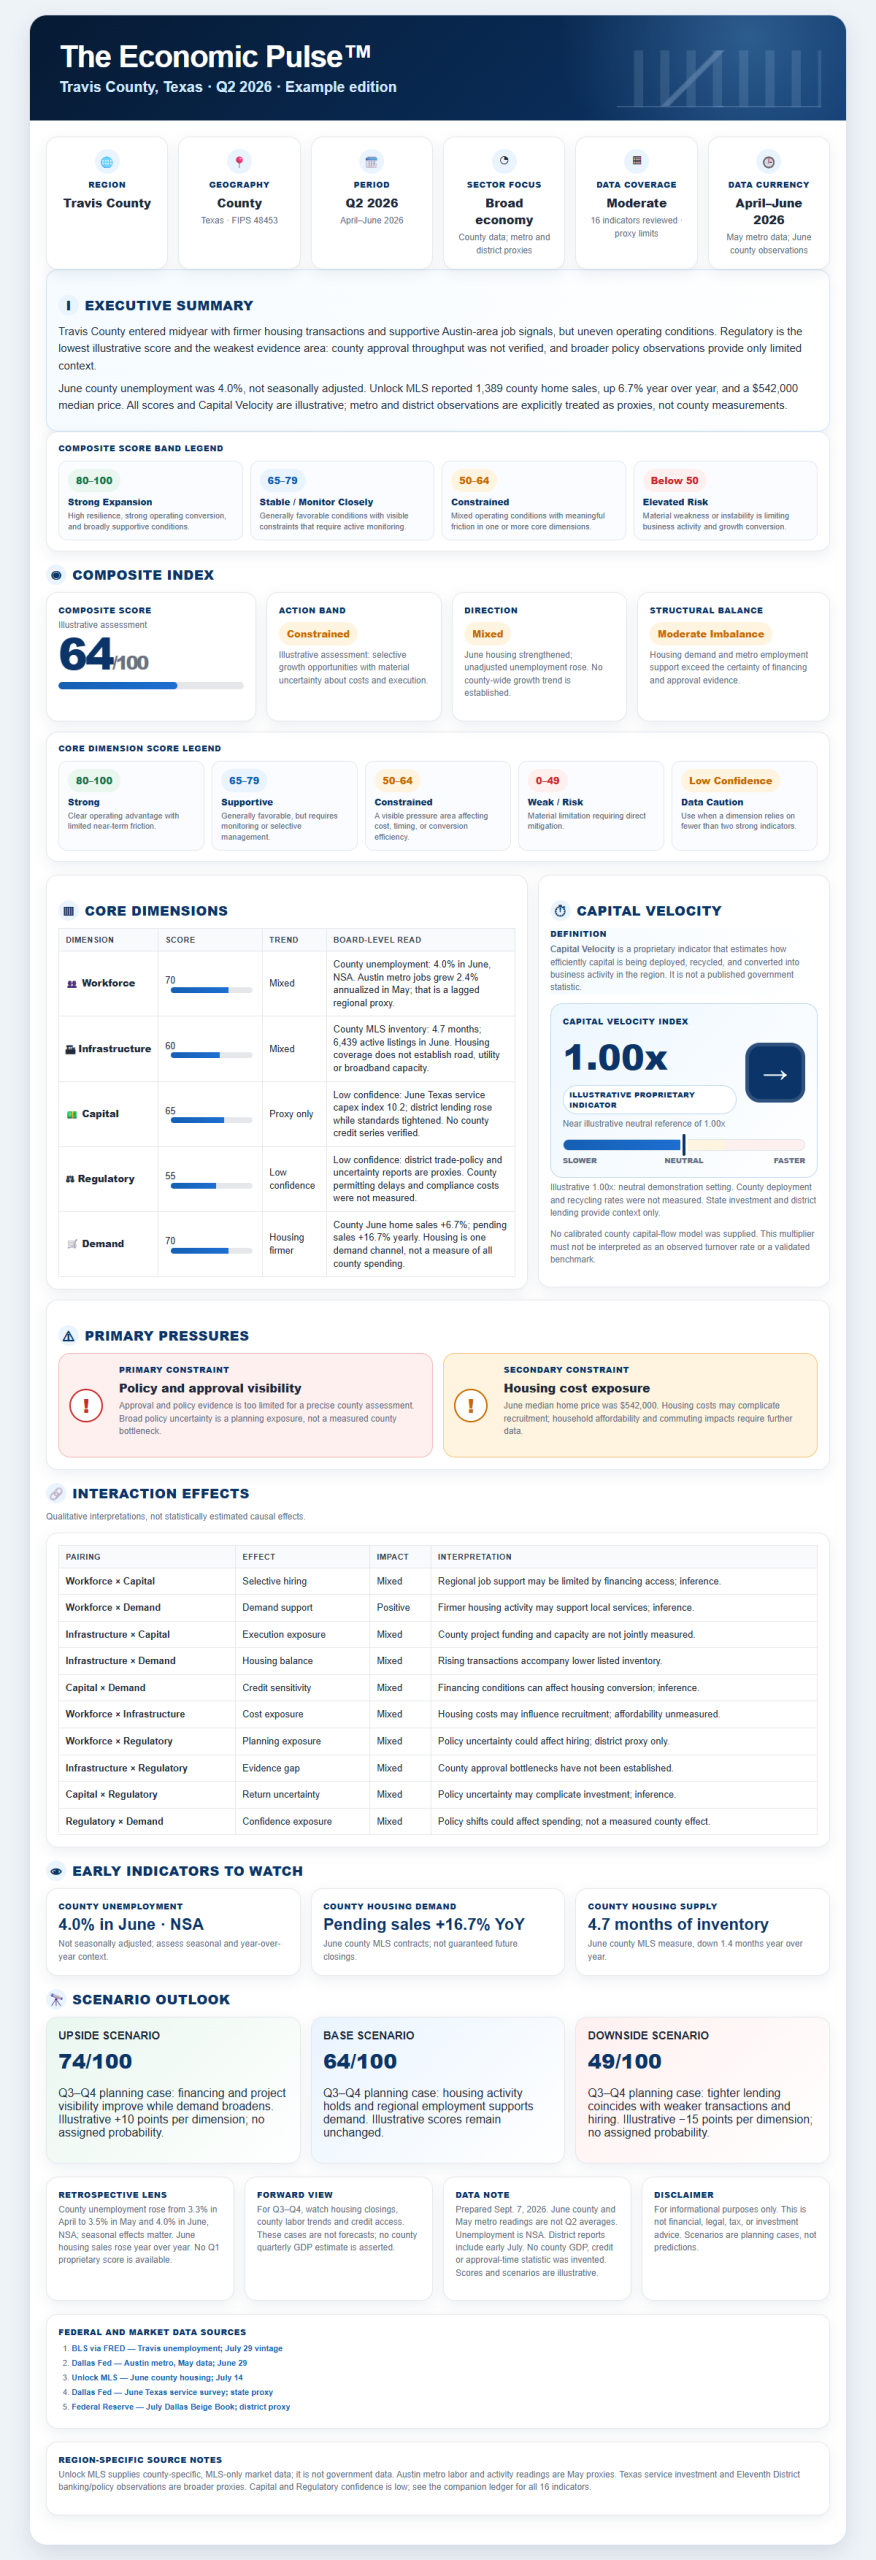
The interactive score is illustrative. Complete Economic Pulse™ reports use standardized public and administrative data, disclosed data lags and proprietary scoring, Capital Velocity, interaction-effect and scenario methodologies.
Five dimensions create ten unique structural relationships.
The Composite Health Score does not rely only on five isolated dimension scores. The Economic Pulse™ also measures every unique pair among those dimensions. These ten interaction effects reveal where otherwise acceptable conditions reinforce one another, where a strong dimension is being blocked, and where two moderate pressures may combine into a larger operating constraint.
1. Workforce × Infrastructure
Whether housing, transportation and physical capacity can support labor availability and mobility.
2. Workforce × Capital
Whether labor conditions support or constrain investment, hiring and expansion.
3. Workforce × Regulatory
How policy, wage pressure and administrative conditions affect hiring and retention.
4. Workforce × Demand
Whether labor supply can support the level of consumer and business activity.
5. Infrastructure × Capital
Whether available capital can convert into housing, logistics, utilities and operating capacity.
6. Infrastructure × Regulatory
How permitting, policy and administrative friction affect physical capacity development.
7. Infrastructure × Demand
Whether physical systems can absorb and convert current demand without bottlenecks.
8. Capital × Regulatory
Whether financing and investment are being delayed, narrowed or redirected by policy friction.
9. Capital × Demand
Whether market demand is strong enough—and stable enough—to support capital deployment.
10. Regulatory × Demand
Whether policy and cost conditions allow demand to convert into durable business activity.
Why this matters: a high dimension score can be misleading when its supporting relationships are weak. The ten interaction effects are a core proprietary differentiator because they show how the environment behaves as a connected structure rather than as five separate indicators.
Who uses the Economic Pulse™—and what they use it for.
| Organization | Primary use | Decision value |
|---|---|---|
| Regional banks | Underwriting posture and lending environment | Separates strong demand from hidden structural constraints. |
| Private equity firms | Market screening and deployment evaluation | Provides standardized regional comparison before deeper diligence. |
| Economic development organizations | Regional stress testing and planning | Clarifies which constraints most affect business attraction and retention. |
| Multi-location operators | Expansion timing and market comparison | Supports consistent comparisons across states and counties. |
| Infrastructure and logistics firms | Deployment-friction analysis | Shows where capacity may lag demand or capital availability. |
| Executive teams | Board-level operating visibility | Compresses fragmented data into one concise structural briefing. |
One framework across every reporting level.
The same standardized model is applied across national, state and county reporting so organizations can compare operating conditions without changing methodologies from one region to another.
Choose geography
Select national, state, county or multi-region coverage.
Align the period
Inputs are standardized to the reporting quarter and data lag is disclosed.
Evaluate structure
Five core dimensions, all ten interaction effects, constraints and the separate Capital Velocity Index are assessed.
Deliver clarity
A concise board-ready briefing provides current conditions and scenario framing.
Transparent inputs. Standardized interpretation.
Economic Pulse™ reports use public and administrative sources such as the Bureau of Labor Statistics, Federal Reserve Economic Data, the U.S. Census Bureau, administrative records and validated proxy indicators where direct regional data is unavailable.
When data is lagged, the lag is disclosed. The Economic Pulse™ Composite Health Score, the separate Capital Velocity Index, all ten interaction effects, constraint hierarchy and scenario ranges are proprietary analytical outputs rather than published government statistics. These elements are the value layer that converts public data into comparable decision intelligence.
Current-state assessment
The Economic Pulse™ is designed to measure the structure of present operating conditions. It is not a market forecast or a speculative narrative.
Scenario framing
Upside, base and downside cases identify what to monitor if pressure resolves, persists or compounds. They are planning cases, not predictions.
Decision boundary
Reports support planning and comparison but do not replace financial, legal, tax, investment, underwriting or site-selection advice.
Questions decision-makers usually ask.
Is the Economic Pulse™ Composite Score proprietary?
Yes. The 0–100 Composite Score is a proprietary Creation Unified measure. Public and administrative data provide the inputs; the Composite Health Score, separate Capital Velocity Index, ten interaction effects, constraint hierarchy and scenario ranges are produced through the Economic Pulse™ analytical framework.
Is the Economic Pulse™ an economic forecast?
No. It evaluates current structural operating conditions and provides conditional scenario framing. It does not claim certainty about future events.
How is Capital Velocity different from economic growth?
Growth measures changes in output. Capital Velocity evaluates how efficiently capital appears to convert into activity such as business formation, employment, construction and demand. An economy can show growth while conversion efficiency weakens.
Can different states or counties be compared directly?
Yes. The framework is standardized across regions, while data availability and lag conditions are disclosed. This supports more consistent regional comparison than relying on unrelated local reports.
Does a high score mean there is no risk?
No. A high score indicates stronger current structural support, not the absence of risk. Each report also identifies constraints, interaction effects and early indicators requiring attention.
Do I need a consulting engagement to understand the report?
No. Each report is designed as a concise, board-ready briefing that can stand on its own. Multi-region licensing and broader institutional arrangements can also be discussed.
Request Economic Pulse™ coverage for your state, county or regional portfolio.
Available options include state subscriptions, county subscriptions, quarterly update packages, multi-region reporting and custom institutional licensing.