
An Exclusive Structural View of Business Conditions Across the United States
The Business Environment Index (BEI) is our proprietary economic intelligence report that produces structured, data-driven briefings for the United States, all 50 U.S. states, and more than 3,000 U.S. counties.
Unlike traditional economic reporting, the BEI is designed to evaluate how operating conditions function as a connected system rather than as isolated statistics. The objective is not to generate forecasts, narratives, or economic commentary. The objective is to provide a measurable view of the structural conditions shaping business performance, capital deployment, operational stability, and regional adaptability.
At its core, the BEI uniquely answers a simple question: How stable is this environment for operating and deploying capital today?
Why the BEI?
REASON #1: Modern organizations have access to enormous amounts of economic data, yet many decision-makers still struggle to translate that information into operational clarity. The BEI summarizes the most important key drivers clearly.
REASON #2: Traditional economic measurements such as GDP, unemployment, inflation, or retail sales provide valuable information, but they are often limited. The BEI gives you a more well rounded picture of how all economic factors are interacting.
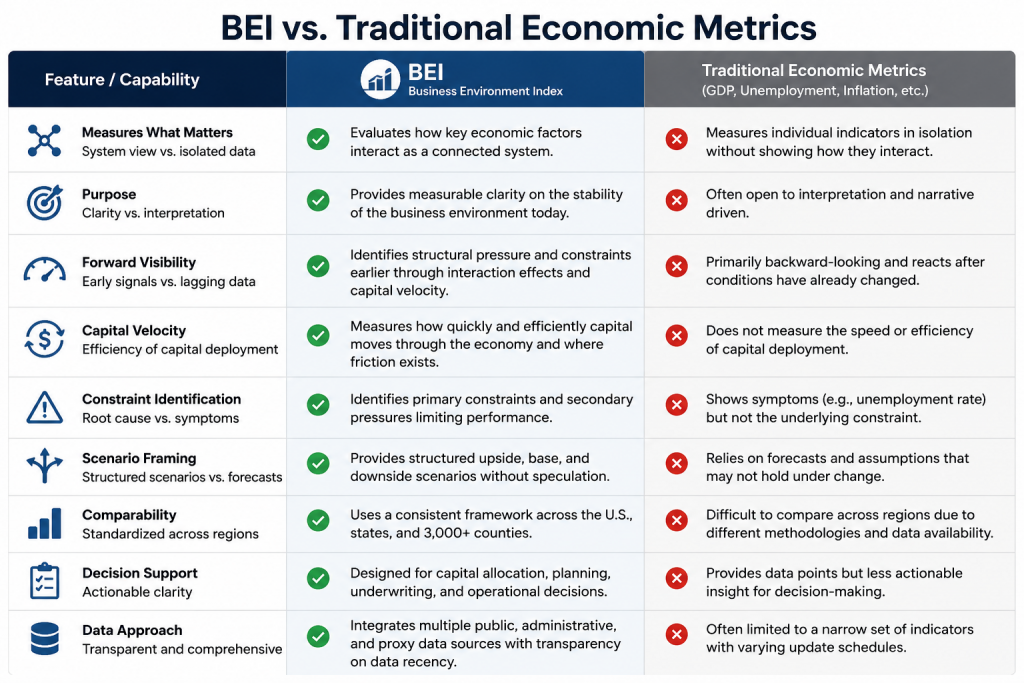
Most existing tools measure isolated variables independently. The BEI was designed to measure how conditions interact. This distinction matters because complex systems rarely fail or strengthen because of a single variable alone. In most operating environments, outcomes are shaped by the interaction between labor conditions, infrastructure capacity, capital access, regulation, demand, and the speed at which resources move through the economy. The BEI attempts to make those structural relationships visible. (NOTE: For the BEI report, the public data is mostly available at end of the following month after a quarter closes.)
What Makes the BEI Different
The BEI does not attempt to predict the future. It does not generate speculative narratives or market opinions. Instead, it translates large volumes of economic and administrative data into a standardized structural assessment of current operating conditions. Each report produces a concise, board-ready briefing designed to support:
- capital allocation,
- regional comparison,
- operational planning,
- underwriting analysis,
- expansion timing,
- infrastructure evaluation,
- and strategic decision-making.
The emphasis is measurable clarity rather than interpretation.
What Each BEI Report Includes
Integrated Stability Score (0–100)
Every report centers on a composite stability score reflecting the overall structural condition of the selected region. This is not a sentiment index or consumer confidence measure. It is a normalized assessment of how stable the environment appears for operating, hiring, investing, lending, building, or deploying capital. The score evaluates the interaction between multiple operating dimensions simultaneously rather than relying on a single headline metric.
Six Core Operating Dimensions
Each BEI report evaluates six dimensions that directly influence business performance and regional operating conditions.
| Dimension | What It Measures |
|---|---|
| Workforce Stability | Labor availability, workforce pressure, employment resilience |
| Infrastructure Capacity | Transportation, logistics, utilities, and operational support systems |
| Capital Access | Lending conditions, financing availability, and capital flow |
| Regulatory Environment | Administrative friction, permitting pressure, and policy stability |
| Market Demand | Consumer and business activity conditions |
| Capital Velocity | The efficiency and speed of capital deployment through the regional economy |
Each category includes:
- a standardized score,
- directional movement,
- and a concise explanation of what is driving conditions.
This allows organizations to evaluate not only where conditions stand, but why conditions are strengthening or weakening.
Capital Velocity: A Different Way to Measure Economic Health
One of the most unique and important differences between the BEI and traditional economic reporting is the inclusion of Capital Velocity. Traditional metrics often focus on total economic size or aggregate output. The BEI additionally evaluates how efficiently capital moves through the system itself.
Capital Velocity attempts to measure:
- how quickly capital converts into activity,
- where deployment friction exists,
- and whether the regional environment is accelerating or slowing operational movement.
This matters because economies can appear stable on the surface while underlying deployment efficiency is weakening internally.
For example:
- lending may slow before employment weakens
- infrastructure bottlenecks may delay investment activity
- operational friction may increase long before GDP reflects instability.
By tracking velocity rather than output alone, the BEI is designed to identify pressure earlier in the cycle.
Interaction Effects: Where Structural Pressure Becomes Visible
Most reporting systems evaluate indicators independently. The BEI evaluates interaction effects. This means the system examines how conditions reinforce, constrain, or destabilize one another across the broader operating environment.
Examples include:
- labor availability relative to demand,
- financing conditions relative to expansion activity,
- infrastructure constraints relative to growth,
- or regulatory friction relative to capital deployment.
These interaction effects are often where hidden structural risk becomes visible.
In practical terms, the BEI helps organizations identify:
- where pressure is compounding,
- where constraints are reinforcing one another,
- and where conditions remain aligned enough to support sustainable expansion.
Constraint Identification
Every BEI report isolates:
- the primary constraint limiting performance,
- and the secondary pressures building behind it.
This allows organizations to identify what is actually restricting:
- growth,
- hiring,
- lending,
- investment,
- expansion,
- or deployment efficiency.
Many organizations react to visible symptoms while missing the deeper structural bottleneck driving the instability. The BEI is designed to improve visibility into those underlying conditions.
Scenario Framing Without Speculation
The BEI does not produce hard forecasts or speculative predictions. Instead, each report includes structured scenario framing designed to identify directional conditions organizations should monitor.
| Scenario | Meaning |
|---|---|
| Upside | Conditions improve and pressure decreases |
| Base | Current structural conditions persist |
| Downside | Existing pressure compounds and stability weakens |
The purpose is not prediction certainty. The purpose is helping organizations understand which conditions are most likely to influence future operating environments if current structural pressures continue building or begin resolving.
Data Sources and Methodology
BEI reports are generated using standardized public and administrative data sources including:
| Source | Purpose |
|---|---|
| Bureau of Labor Statistics (BLS) | Employment and workforce data |
| Federal Reserve Economic Data (FRED) | Financial and macroeconomic indicators |
| U.S. Census Bureau | Demographic and business activity data |
| Administrative Records | Regional and operational datasets |
| Validated Proxy Indicators | Supplemental estimation where direct data is unavailable |
All inputs are standardized and aligned to the selected reporting period. When data is lagged, that condition is disclosed rather than hidden. The objective is consistency, transparency, and comparability across regions.
Who Uses the BEI
The BEI is designed for organizations whose decisions depend on understanding regional operating conditions clearly and consistently.
Typical use cases include:
| Organization Type | Common Use |
|---|---|
| Regional Banks | Underwriting posture and lending environment assessment |
| Private Equity Firms | Market screening and deployment evaluation |
| Economic Development Organizations | Regional stress testing and planning |
| Multi-Location Operators | Expansion timing and market comparison |
| Infrastructure & Logistics Firms | Deployment friction analysis |
| Executive Teams | Board-level operational visibility |
Each report is designed to stand on its own without requiring a consulting engagement or extensive interpretation layer.
Free National Archive and Subscription Coverage
This page links to the free public archive of national U.S. BEI video briefings.
Coverage options include:
- United States national baseline reports (FREE)
- all 50 U.S. states (subscription per state)
- and 3,000+ U.S. counties (subscription per county)
| Coverage Level | Access |
|---|---|
| United States | Free video archive |
| State Reports | Paid subscription |
| County Reports | Paid subscription |
The same standardized framework is applied consistently across every reporting level, allowing organizations to compare operating conditions across regions using a unified structural model.
The Goal of the BEI
The Business Environment Index was built around a simple premise:
Volume alone does not create clarity.
As operating environments become more complex, state and county level organizations increasingly need systems capable of translating fragmented economic information into measurable structural visibility.
The BEI is designed to provide that visibility by helping organizations understand:
- what is happening,
- what is driving conditions,
- where pressure is building,
- and how stable the operating environment appears for deploying capital and making strategic decisions.
The objective is not interpretation.
The objective is measurable clarity.
Request a BEI State or County Quote
State and county-level BEI reports are available by subscription and licensing arrangement.
Contact Creation Unified to request:
- State-level coverage,
- County-level coverage,
- Multi-region reporting,
- Quarterly update packages,
- or custom institutional licensing.